This analysis explores data from PRI’s 2023 reporting framework to chart the development of RI practices globally. It shares insights from 2,859 investor signatories that reported publicly.
The report highlights progress made by signatories since the last reporting cycle in 2021, whilst also shining a light on areas where practices remain nascent.
This report focuses on global level trends. Additional in-depth analysis of developments in specific regions and asset classes is being conducted and shared with signatories through tailored sessions and guidance.
The analysis was supported by the consultancies Aon and Baringa. It builds upon findings in previous analyses of PRI reporting data.
Key findings
Investors globally are continuing to progress their RI practices.
- From 2021 to 2023, signatories’ RI policies became more comprehensive (see p.15).
- Over that period, the proportion not identifying climate-related risks and opportunities fell from 20% to 16% (see p.32).
- The percentage identifying sustainability outcomes connected to their investment activities rose from 66% to 79% (see p.20).
- While there has been pushback in certain markets against some RI practices, such as collaborative engagement, this has not stopped overall advancement.
Signatories publicly available RI policy elements
Source: indicators PGS 3 (2023), ISP 2 (2021)
When the respondent count for an indicator option is less than 50, no percentage is displayed.
Percentage including specific elements in stewardship policies
Source: indicators PGS 5 (2023), ISP 12 (2021)
When the respondent count for an indicator option is less than 50, no percentage is displayed.
Numerous data points show asset owners demonstrating more ambition and action on RI than investment managers.
- Investment managers are significantly less likely than asset owners to be using scenario analysis to assess the resilience of their investment strategies under specified climate scenarios (34% vs 59%) (see p.33).
- Collaborative engagement is prioritised by a higher proportion of asset owners than managers (see p.18).
- A higher proportion of asset owners are using the Paris Agreement to identify sustainability outcomes (see p.20).
- A greater percentage of asset owners provide regular reporting on human rights, climate change, stewardship activity and other RI aspects (see p.17).
- When considering these data points, it is important to bear in mind the differences in organisational structure and objectives that exist between and within different categories of investment organisations.
Percentage of signatories that include the RI elements specified below in regular reporting to clients and / or beneficiaries (2023)
Source: indicator PGS 16 (2023). The data displayed covers the majority of investors’ AUM
When the respondent count for an indicator option is less than 50, no percentage is displayed.
Asset owners’ assessments of external investment managers have become more comprehensive, but some areas lag.
- The vast majority of asset owners are reviewing how their current and potential external managers incorporate material ESG factors within the investment process (see p.24).
- Higher numbers of allocators are including RI requirements in contracts (see p.25).
- It remains the case that asset owners are doing less thorough assessments of managers of passive strategies (see p.26).
- The monitoring of managers’ specific stewardship activities, such as their proxy voting records, remains limited (see p.25).
- Compared to 2021, a higher percentage of asset owners are engaging with managers and following an escalation process when concerns surface regarding managers’ RI practices (see p.27).
Action on sustainability outcomes is on the rise. Questions around how to measure and manage such outcomes are gaining more attention.
- There has been an increase since 2021 in the proportion of PRI signatories identifying and acting on sustainability outcomes (see p.20).
- United Nations goals and frameworks are the focal point for investor action on sustainability outcomes (see p.20).
- A significant number of signatories now manage and / or allocate to investment strategies with sustainability outcomes goals.
Percentage using specified frameworks to identify sustainability outcomes (2023)
Source: indicator PGS 47.1 (2023)
When the respondent count for an indicator option is less than 50, no percentage is displayed.
Investors globally are recognising the urgency of addressing climate change, and net-zero pledges are increasing, but sophistication of approaches varies significantly.
- At one end of the spectrum, hundreds of PRI signatories have committed to transitioning their investment portfolios to net-zero GHG emissions by 2050 or sooner and are doing in-depth work to achieve these objectives. At the other, there is a subset of signatories that are not taking the steps of identifying climate-related risks and opportunities connected to their investments (see p.32).
Percentage using and or disclosing climate metrics (2023)
Source: indicator PGS 45 (2023)
When the respondent count for an indicator option is less than 50, no percentage is displayed.
Biodiversity is rising up the agenda for investors.
- The proportion of signatories that has outlined near-term steps to protect nature and biodiversity in their PRI senior leadership statements has increased around fourfold since 2021 (see p.13).
- The adoption of the Kunming-Montreal Global Biodiversity Framework and the launch of the Taskforce on Nature-related Financial Disclosures (TNFD) recommendations are catalysing investor action in this area.
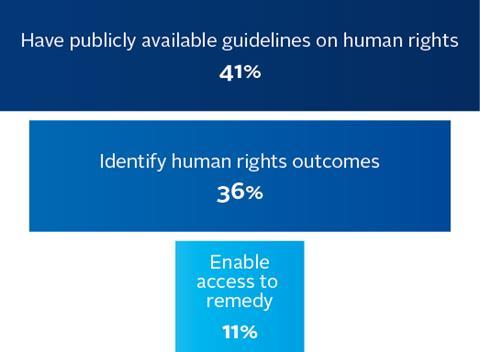
Human rights are increasingly in focus, but implementation of the UN Guiding Principles on Business and Human Rights (UNGPs) remains limited.
- The proportion of signatories that include guidelines on social issues in their RI policies has increased from 54% in 2021 to 63% in 2023 (see p.15).
- Only a small minority has fully implemented the UNGPs (see p.36).
Figure 1. Source: indicators PGS 3, 47.1, 50 (2023). Denominator: 2,859

Levels of ESG integration are high across a wide spectrum of asset classes.
- The vast majority of PRI signatories are integrating ESG factors into their investment analysis and decision-making. This is true for investors in both publicly and privately traded assets (see pp.28 and 30).
- Even in some asset classes where levels of ESG integration have tended to lag, such as sovereign debt, a significant majority of investors are now taking steps to integrate ESG factors (see p.28).
North American signatories continue to advance in key areas but generally make fewer public disclosures on RI than those based in Europe, Oceania, and Asia.
- North American signatories have progressed on a number of metrics over recent reporting cycles. For example, the percentage identifying sustainability outcomes increased from 58% in 2021 to 71% in 2023.
- The proportion of North American signatories that have RI policies is in line with that of other regions. However, 16% have not made their RI policies publicly available, which is notably higher than for regions such as Oceania and Europe (see p.16).
- Fewer North American investors are reporting on their RI activity for the majority of their AUM relative to peers from other regions (see p.17).
Resource constraints are a significant barrier to RI.
- Resource-intensive RI practices are much more prevalent among investors in larger AUM brackets.
- The proportion of investors using scenario analysis is five times higher in the US$250bn+ AUM bracket than it is for investors with US$0-0.99bn in AUM (see p.33).
- Larger investors are also notably more likely to be engaging directly with policy makers (see p.19).
- Resource constraints partially explain why larger managers are significantly more likely than smaller ones to undertake these kinds of RI practices; although it is also the case that larger investors tend to be subject to more regulatory requirements.
Download the full report below.


