| ORGANISATION DETAILS | |
|---|---|
| Name | Impax Asset Management |
| Signatory type | Investment manager |
| Region of operation | UK, US, HK |
| Assets under management | £18.5bn (as of 31st July 2020) |
| COVERED IN THIS CASE STUDY | |
|---|---|
| Name of fund | N/A |
| Sector |
Agriculture, manufacturing, electricity production, waste management, buildings |
| Asset class | Listed equities |
| Geography | EU, China |
| Environmental objective |
Mitigation |
| Economic activity |
2.4 Livestock production |
Impax is a specialist asset manager focused on investing in opportunities arising from the transition to a sustainable economy. In order to identify a universe of suitable stocks we developed the Impax Environmental Taxonomy (IET) in 1999, which still plays a central role in our investment approach. We consider that taxonomies are a key tool for driving capital towards environmental and climate action but they need to be designed and implemented so they are user-friendly, aligned to available data, responsive to technological developments, and used as a tool that informs, rather than dictates, stock selection.
Other aspect you would like to mention?
We assessed five investee companies in Europe and China to explore the usability of the EU taxonomy (EUT) from the perspective of an asset manager investing in listed equities. Appendix I provides an analysis of individual companies.
Taxonomy implementation
Principles, criteria, thresholds
In order to assess whether companies were carrying out economic activities considered environmentally sustainable under the taxonomy regulation, we used the five-step process set out in section 3.3.11 of the Technical Expert Group (TEG) Final Report:
a) Identify percentage of the company’s activities eligible for technical screening
b) Verify percentage of the company’s activities that meet the technical screening criteria and thresholds
c) Verify whether Do No Significant Harm (DNSH) is being met
d) Investigate violation of social minimum safeguards
e) Calculate (in accordance with TEG Final Report section 3.3.7)
1. Percentage of aligned activities (i.e. “that can be demonstrated to align with the taxonomy”) and
2. Percentage of potentially aligned activities i.e. where “investor has good reason to believe that the underlying activity is aligned, but full compliance has not been demonstrated”.
In relation to the first step, the IET classifies its universe of stocks by environmental sectors and subsectors. To identify overlaps and differences between the IET and the EUT, we mapped the EUT activities onto the corresponding IET subsectors and used this as a starting point to consider how an investee company could be evaluated under the EUT. We also used the Bloomberg WATC EUTAX feature to cross check if the EUT activities we identified were in line with Bloomberg’s assessment.
Do no significant harm assessment
In the absence of activity-level data for the DNSH assessment, we used a company-level proxy test, leveraging data from the most recent MSCI ESG controversy scores. We determined that the company passed this assessment if it had not been involved in controversy cases indicating severe or very severe environmental impact across any of the seven themes within the Environmental pillar:
- Energy & Climate Change
- Water Stress
- Biodiversity & Land Use
- Toxic Emissions & Waste
- Operational Waste (Non-Hazardous)
- Supply Chain Management
- Other (Environment)
Social safeguards assessment
In the absence of activity-level data for the social safeguards assessment, again we used a company-level proxy test. We considered the company qualified if it had not been involved in controversy cases indicating severe or very severe Social or Governance impact across any of the following sub-pillars:
- Customers (marketing & advertising practices, privacy & data security, product safety & quality)
- Human rights & community impact
- Labour rights within operations and the supply chain
- Corporate Governance (bribery & fraud, controversial investments, governance structures)
Turnover/capex/opex alignment
We used the latest publicly-disclosed revenue data to determine percentage alignment with the taxonomy. When this disclosure was not sufficiently granular to meet the requirements of the EUT (e.g., when the revenue of a business segment encompassed a number of different EUT activities without further revenue breakdown), we split revenues based on assumptions.
Capex was also considered in specific situations, e.g., for a company that generates electricity from both coal and renewables - to analyse the company’s transition plans and strategies to improve overall environmental sustainability performance. Provided the company passed the DNSH and social safeguards assessments, we qualified their business activities as taxonomy-aligned. We aggregated the percentage alignment of each activity to calculate overall percentage alignment with the EUT.
Additional comments
We only used publicly-available information and internal databases when undertaking company assessments. Public sources included Bloomberg, company websites and presentations, annual reports, MSCI ESG controversy ratings and Sustainalytics Global Standards Screen (UN Global Compact).
We deliberately did not engage with companies to collect additional data. In the absence of data to verify that the company’s activities met the mitigation criteria thresholds, we followed the recommendation in the TEG Final Report to assume they did not meet the requirements. Therefore, the percentage alignment is likely to be an underestimation.
Alignment results
The main results of the EU taxonomy alignment of the five companies assessed are summarised below. Please refer to Appendix I for a more detailed individual analysis of Companies C and D.
| Company & Industry | IET Subsector | EUT Activities Considered* | % Potentially Aligned Activities** | DNSH & Social Safeguards Assessment | % Aligned Activities*** | Rationale for Excluding Potentially Aligned Activities |
|---|---|---|---|---|---|---|
|
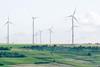
Company A (Europe) Electric utility, renewable energy generation |
Renewable Energy Developers & IPPs |
4.3 Production of electricity from wind power |
100% |
Pass |
100% |
|
|
Company B (China) Electric utility, renewable energy generation |
Renewable Energy Developers & IPPs |
4.3 Production of electricity from wind power |
69% |
Pass |
69% (based on revenue) 97.5% (based on Capex) |
|
|
Company C (Europe) Manufacturer of performance insulation and building envelope technologies |
Buildings Energy Efficiency |
3.1 Manufacture of low carbon technologies
8.3 Individual measures and professional services |
84% |
Pass |
84% |
|
|
Company D (Europe) Manufacturer of specialty chemicals (life sciences, materials sciences) |
Sustainable & Efficient Agriculture Buildings Energy Efficiency Wind Power Generation Equipment |
2.4 Livestock production
3.1 Manufacture of low carbon technologies |
63% |
Pass |
2% |
Unable to determine whether the products’ avoided emissions met the criteria in Activity 3.1 (see appendix for details) |
|
Company E (Europe) Manufacturer of waste technology equipment |
Waste Technology Equipment |
3.1 Manufacture of low carbon technologies
5.4 Separate collection and transport of non-hazardous waste in source segregated fractions
5.7 Material recovery from non-hazardous waste |
100% |
Pass |
66% |
Unable to determine whether the products’ avoided emissions met the criteria in Activity 3.1 so assessed against Activities 5.4 and 5.7 |
* Where there was more than one EU Taxonomy activity considered, we used those highlighted in bold as the basis for calculating taxonomy % alignment.
** “Potentially aligned activities” refer to activities that “investor has good reason to believe that the underlying activity is aligned, but full compliance has not been demonstrated” (see section 3.3.7 TEG Final Report).
*** “Aligned activities” refer to activities that can be demonstrated to align with the taxonomy (see section 3.3.4 TEG Final Report).
We were surprised at the low percentage alignment of Company D, as it is making a substantial contribution to climate change mitigation through their products, with figures showing significant reductions or avoidance of GHG emissions. Climate mitigation is a core aspect of its mission statement and it is assessed internally as holding the three highest ESG ratings. We were therefore particularly interested to understand the reasons behind the low level of alignment.
Challenges and solutions
| NO. | CHALLENGE | SOLUTION |
|---|---|---|
| 1 | Stage 1: Identifying the relevant EU taxonomy activity Challenge: In some cases, we found it slightly difficult to map the company’s business activities to the appropriate taxonomy activities. Intuition could take us to more than one suitable match. |
We reviewed the description of potential taxonomy activities in more detail to ensure we understood the exact scope of each activity, in order to identify the best suitable match. We also leveraged Bloomberg’s approach of allocating the company’s activities to EU Taxonomy activities. Examples: Companies C, D and E |
| 2 | Stage 2: Verifying whether the company’s activities met the technical screening criteria and thresholds Challenge: We found it difficult to demonstrate whether the company’s activities met the technical screening criteria when some of the criteria, including thresholds, were unclear. |
Where the criteria lacked clarity, we used our own judgement to interpret the technical screening criteria and the respective thresholds.Where it was not clear what evidence was required by the criteria, we could not demonstrate that the activities met the criteria. Therefore, we followed the recommendation in the TEG Final Report to assume they did not meet the requirements. Examples: Companies D and E |
| 3 | Stage 3: Conducting the DNSH and social safeguards assessments Challenge: Activity-level data to assess DNSH and social safeguards was not available. |
We used company-level proxy data (controversies and corporate conduct) from third party providers to carry out the assessments. Examples: Companies A, B, C, D and E |
Recommendations
1. Companies should publish data demonstrating alignment with the EU Taxonomy
The main reason for the generally low level of alignment was likely to be the recommendation that the activities should be excluded if there was insufficient data to verify whether they met the required standards. Given the lack of public data, companies wishing to demonstrate their alignment may choose to proactively disclose verified data addressing the relevant technical criteria.
2. Match the EU Taxonomy activities with the company’s activities accurately and carefully
Consider the scope of the EU Taxonomy activities carefully, taking note that the taxonomy generally refers to the company that is conducting the relevant activity. Therefore, a company that is providing a service, or enabling another company to conduct the relevant activity, may or may not be in scope itself. For example, Company E manufactures reverse vending machines (RVMs) which are mentioned under Activity 5.4. However, since that activity relates to the collection of waste rather than the manufacture or distribution of RVMs, the appropriate taxonomy activity is likely to be “3.1 Manufacture of low carbon technologies”.
3. Allow sufficient time and expertise for taxonomy assessment
It takes time to become familiar with the EU taxonomy. It is important to start preparing early. If possible, involve technical experts to speed up the learning process.
Appendix I: Individual Company Analysis
1. Company C: Manufacturer of performance insulation and building envelope technologies
| Business Segment | % Revenue | Potentially aligned? | Criteria met? | % Aligned |
|---|---|---|---|---|
|
Insulated Panels & Boards |
||||
|
Insulated Panels |
65% |
Y |
Y |
65% |
|
Insulation Boards |
19% |
Y |
Y |
19% |
|
Light & Air |
7% |
Ventilation systems only |
N |
0% |
|
Access Floors |
5% |
N |
||
|
Environmental & Renewables |
4% |
N |
||
|
Total % Alignment |
84% |
|||
Company C is a global leader in high-performance insulation and building envelopes. Its stated mission is to hasten a net zero emissions future through enabling high-performance buildings that save energy, carbon and water. The company claims that total GHGs saved over the lifetime (60 years) of its insulation systems, sold worldwide in 2019, will be around 175 million tonnes of CO₂e.
Company C’s insulation panels & boards (84% of revenue) and ventilation systems fall within the scope of “3.1 Manufacture of low carbon technologies”. We found that all of its insulation products have lambda values lower than 0.045 W/mK (see page 163 of the TEG Technical Annex). Therefore, they met the required threshold in the technical screening criteria. However, we were unable to find evidence in general corporate disclosures (e.g. website and annual reports) to demonstrate that its ventilation systems were “rated in the highest energy efficiency class” (see page 164). Therefore, we followed the recommendation in the TEG Final Report to assume they did not meet the specific criteria. However, we do believe that the company would be able to provide the required information if we engaged with them.
We initially considered that the company’s insulation products might fall within the scope of “8.3 Individual measures and professional services” under the “Construction and Real Estate Activities” sector, which refers to the installation of insulation products to existing envelope components. However, given that the company manufactures rather than installs insulation products, we decided to assess its eligibility against Activity 3.1
During our assessment, we identified two other points of note:
1) Inconsistency between the corresponding criteria for the installation and manufacture of the same products, which are respectively identified in Activities 8.3 and 3.1. For example, in 8.3, the insulation products should be compliant with “national regulations transposing the Energy Performance of Buildings Initiative (EPBD)” and Ecodesign requirements, whereas in 3.1, they should meet certain lambda value.
2) Company C’s natural daylighting systems can help save energy and emissions by reducing the use of (energy efficient) lighting appliances. However, natural daylighting solutions are not included in the taxonomy, whilst energy efficient lighting appliances are included.
DNSH & Social Safeguards Assessment:PASS
2. Company D: Manufacturer of speciality chemicals (life sciences, materials sciences)
| Business Segment | % Revenue | Potentially aligned? | Criteria met? | % Aligned |
|---|---|---|---|---|
|
Nutrition |
||||
|
Nutritional Products |
||||
|
Animal Nutrition & Health |
32% |
Y/N |
N |
0% |
|
Human Nutrition & Health |
23% |
N |
||
|
Personal Care and Aroma Ingredients |
5% |
N |
||
|
Other |
1% |
N |
||
|
Food Specialities |
6% |
N |
||
|
Performance Materials |
||||
|
Engineering Plastics |
16% |
Y |
N |
0% |
|
Resins & Functional Materials |
11% |
Y |
N |
0% |
|
Fibre |
4% |
Y |
50% |
2% |
|
Innovation Centre |
2% |
N |
||
|
Corporate Activities |
0% |
N |
||
|
Total % Alignment |
2% |
|||
Company D supports a low-carbon economy through its animal feed solutions, which promote resource efficiency and reduce GHGs, as well as through its high-performance materials, which improve energy efficiency and lower emissions in the automotive, maritime and food sectors. According to its Annual Report 2019, its engineering plastics products alone contributed to estimated avoided emissions of more than 25 million tonnes of CO2 eq in 2019, more than double its Scope 1, 2, 3 GHG emissions combined.
Nutrition
We considered whether the company’s animal nutrition products fell within the scope of Activity 2.4 Livestock Production, but we were uncertain as this activity appeared to refer to the operator of the farm (see references to management practices). The company manufactures animal feed additives, which it sells to farm operators, and therefore, strictly speaking, the manufacturing activity itself probably falls outside the scope of Activity 2.4. However, as there are references to animal feeding in the discussion of Activity 2.4 on page 144 of the TEG Technical Annex, we decided to pursue our analysis further.
Within Activity 2.4, there are two options for animal feed:
i. Feed additives which reduce methane emissions from ruminants (e.g. cows or sheep)
ii. Precision-feeding techniques which increase feed efficiency
We noted that the company’s animal feed products which reduce GHGs are mainly sold to the poultry and pork industry, i.e. not ruminants. They include a feed preservative that improves feed conversion for pigs (saving estimated emissions of 263 kt CO2 eq in 2018), and a food additive that improves feed conversion for broiler chickens (saving estimated emissions of approximately 9 million tonnes of CO2 in 2019).
The company has also developed a feed additive that can cut methane emissions from dairy cows by inhibiting the enzyme that triggers methane production in a cow’s stomach, but this has not yet been commercialised. We concluded that the company’s activities do not fall within Activity 2.4, as it is not currently deriving revenue from ruminant feed additives that reduce GHGs.
Performance materials
The company’s advanced materials have many applications, some of which contribute to climate benefits and avoided emissions as described further below. We considered the entire Performance Materials segment to be in scope of “3.1 Manufacture of low carbon technologies”.
The company has developed a high-tech, lightweight, strong fibre, which is a key component in the manufacture of ropes, slings and synthetic chain used to install and anchor offshore wind turbines. These ropes and slings could be considered essential for wind energy, which potentially would bring them within the scope of Activity 3.1 (see page 162 of the TEG Technical Annex). While the fibre has a wide range of other applications (e.g., personal protection, workwear and sports apparel, outdoor equipment and nets for the aquaculture sector), we did not find any information on this breakdown in publicly-disclosed information. Therefore, we assumed that 50% of the revenue in the fibre segment (4% of overall company revenue) derived from wind energy related applications.
Company D’s annual report 2019 highlights further examples of how its products in the Performance Materials segment may lead to avoided emissions (such as packaging products which reduce food waste and powder coating resins which remove the need for solvents). However, there was insufficient information to determine whether these avoided emissions are considered “substantial higher net GHG emission reductions compared to the best performing alternative technology/ product/ solution available in the market on the basis of a recognised carbon footprint assessment validated by a third party” as required in Activity 3.1 (section 4). Therefore, we followed the recommendation in the TEG Final Report and assumed its products did not meet the specific criteria.
DNSH & Social Safeguards Assessment: PASS