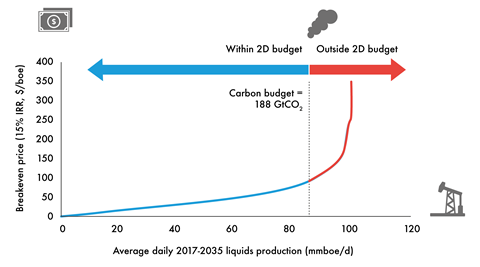
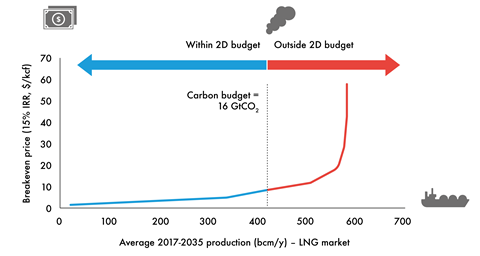
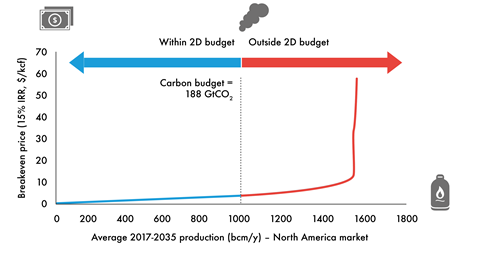
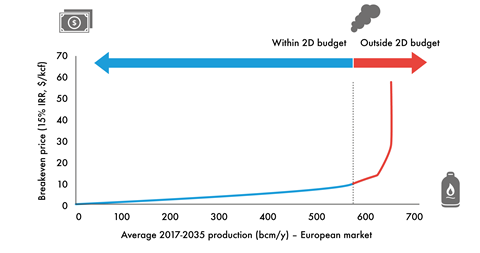
To supply these levels of oil and gas, the most economic projects are selected – i.e. those on the left-hand side of the cost curve ordered by breakeven price. This leaves the highest cost options as those that would not need to proceed under a 2D scenario, assuming economic logic plays out. The breakeven price is the oil or gas price required to give a NPV of zero for each asset using a given discount rate or internal rate of return (IRR). In this case, we have used an IRR of 15%, illustrative of the minimum target return we see as being satisfactory for sanction given risks such as cost overruns, etc.
Global oil production is plotted on a single supply curve. Natural gas supply is split into regional markets – Europe, North America and global LNG. This means that the approach attempts to more closely replicate the regional allocation of the carbon budget, which will give a different result to combining all gas globally on the same cost curve. Domestic gas markets are assumed unchanged in a 2D scenario and account for 75 GtCO2.
Oil carbon supply cost curve
As a global market, the oil supply cost curve incorporates a wide range of different types of resource with different supply costs and different CO2 intensities. The high-cost projects are also typically the highest carbon, for example new oil sands or some deepwater projects.

LNG carbon supply cost curve
Tight LNG markets and high pricing post-Fukushima encouraged over-investment in LNG liquefaction capacity, resulting in sharply lower prices for seaborne gas. Despite growth in demand, the market is generally expected to be oversupplied until the early to mid-2020s, and this overhang can be seen in the unneeded portion of supply. The weakness seen in gas prices has not incentivised further investment in new capacity, and has already resulted in some existing assets taking impairments. As well as typically being higher cost than other sources of gas, LNG is higher carbon due to the greater energy required to liquefy and transport it.

North American gas carbon supply cost curve
Increased production of North American gas has resulted in low prices and a favourable competitive position against coal, driving increased power sector use and lowering CO2 emissions. Lower levels of activity have reduced sub-contracting and supply chain costs, which will rise again if drilling ramps up materially strengthening the position of service providers. The efficiency gains and standardisation of drilling techniques provide a more permanent element to reduction in costs. These effects combine to move the whole cost curve down over the last couple of years. However, the resulting resource upgrades mean that there is also a significant proportion that is outside the 2D budget, even though supply costs are relatively low through much of the curve.

European gas supply cost curve
Gas for the European market is mostly needed despite weak energy demand – UK North Sea production has peaked, Norway is unlikely to have much scope to expand production significantly, and geological concerns have led to the imposition of increasingly strict quotas on production from the giant Groningen field in the Netherlands. Shale production remains something of an unknown, but the US’s success is unlikely to be repeated given more challenging sub-surface conditions and a range of social and environmental concerns, amongst other factors.

View the full report
-

2 degrees of separation: Transition risk for oil and gas in a low carbon world
July 2017
Produced in collaboration with Carbon Tracker
![]()
References
2 degrees of separation: Transition risk for oil and gas in a low carbon world
- 1
- 2
- 3
- 4
 Currently reading
Carbon supply cost curves
- 5
- 6
- 7


