La Française Asset Management
Signatory type: Asset management
AUM: $50bn
HQ location: France
Covered in this case study
Asset class: Equity
La Française Asset Management (LFAM) offers investment solutions for third parties across fixed income and equity asset classes. Our Sustainable Investment Research team establishes its own proprietary methodologies, including its methodology to measure a portfolio holding’s carbon trajectory towards net zero.
Why we measure the portfolio temperature of our investments
In the absence of a suitable methodology in the market, we believe it is necessary to develop a bespoke and more accurate measurement approach. Building a proprietary approach also allows us to leverage our own Low Carbon Trajectory (LCT) model for companies in high-emitting sectors. This is a forward-looking model that seeks to estimate future emissions up to 2030, which is where our Portfolio Temperature Ratings Tool also stops.
The main reasons for using the Portfolio Temperature Ratings Tool are:
1. To support investment decisions and portfolio construction in line with climate objectives of our clients (such as a particular scenario or with the 1.5°C Paris Agreement target).
2. To build our commitment to the Net Zero Asset Managers initiative. In order to commit to a net-zero trajectory, we have to proceed on a portfolio-by-portfolio basis.
3. To support our engagement with corporate issuers to ensure real-world impact.
4. To enable effective client reporting.
How our Portfolio Temperature Ratings Tool works
The Portfolio Temperature Ratings Tool is based on the open-source methodology developed by the partner organisations of the Science Based Targets initiative (SBTi) – CDP and WWF. The methodology aims to translate reported corporate targets into long-term temperature trajectories. As the methodology is open source and transparent, it allows us to identify the areas we can complete with our own expertise.
The tool can be applied on a fund-by-fund basis. It allows us, where appropriate, to use our own assumptions to ensure consistency of climate risk management at LFAM, to integrate temperature ratings already calculated by our in-house sector-specific LCT model, and to reflect new developments at an early stage.
Our tool to calculate portfolio temperature ratings uses the following scenarios:
1. IPCC SR15 (CDP-WWF Temperature Ratings)
2. Climate Action Tracker’s Current Policies scenario
3. IEA’s Sustainable Development Scenario and Net Zero Emissions by 2050 Scenario
A carbon reduction target represents the ambition of a corporate issuer to take climate action over time. This process is referred to as “alignment” of the issuers’ carbon reduction plans with a scientific carbon-reduction pathway. The alignment can be measured cumulatively over time (budget over/undershooting) or as a point-in-time assessment with a given pathway. The Portfolio Temperature Ratings Tool uses both approaches.
Temperature rating at the issuer level
The main input to our tool is the CDP temperature rating dataset, which we selected because it follows the SBTi requirements. It covers about 3,300 companies and assigns a specific temperature to each of those. However, of those 3,300 companies, two thirds are assigned a default rating due to lack of data on Scope 1 and 2 greenhouse gas (GHG) emissions, rising to more than 80% for Scope 3 emissions.
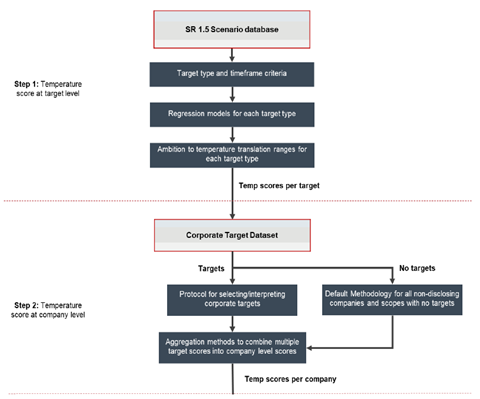
Figure 1 illustrates, in step 1, how CDP-WWF’s methodology converts a range of climate-related metrics and targets into temperature scores. This is achieved by generating a regression model for estimated warming in 2100 using climate scenarios with short-, medium-, and long-term trends in absolute emissions and emissions intensity. Given that companies have multiple emissions targets across scopes and timeframes, in step 2 a protocol is used to aggregate all target data into scores at a company level.
Figure 1: CDP-WWF Temperature Rating Methodology at issuer level
Source: CDP-WWF (p.5, October 2020)
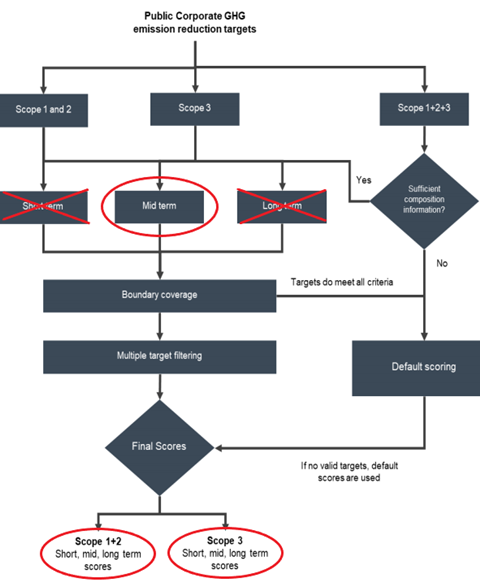
As shown in Figure 2 the CDP-WWF methodology has three different time frames to aggregate carbon reduction targets of an issuer: short term (2021-2024), medium term (2025-2035) and long term (2035-2050). LFAM has decided to use only mid-term temperature ratings because they are in line with our LCT methodology, which analyses companies’ trajectories over the medium term from 2019 to 2030.
Figure 2: CDP-WWF Temperature Rating Methodology target aggregation at issuer level
Source: CDP-WWF (October 2020)
CDP-WWF aggregates individual targets into two temperature ratings: one for Scope 1 and 2 emissions, and one for Scope 3 as shown in red circles in Figure 2, however LFAM uses only the mid-term score. In order to further aggregate the two ratings, LFAM combines the two mid-term scores using the issuer’s emissions split between Scopes 1 and 2 and Scope 3 as the weightings.
CDP decided to exclude from the dataset all companies that did not disclose information through their climate change programme. This excludes many companies and could have a detrimental impact on engagement by not giving investors any incentive to get companies to disclose to CDP, particularly in high-emitting sectors. We therefore decided to assign the 3.1°C default temperature score, as recommended by Planet Tracker, to all companies for which CDP or ourselves do not have any target. This means our tool reaches a high level of portfolio coverage, albeit at the expense of accuracy. For those companies that do not disclose to CDP, but disclose in their financial report, our Sustainable Investment Research team draws on its own research.
Aggregating temperature ratings by scope
To derive our mid-term temperature rating for an issuer based on all three scopes, we aggregate the different scopes to get a mid-term temperature rating for each issuer for Scopes 1 and 2, and Scopes 1, 2 and 3. We calculate a weighted average based on the issuer’s carbon emissions for all three scopes as shown below:
Scope 1, 2 and 3 temperature rating =
(1-share of Scope 3) * Scope 1 and 2 temperature = share of Scope 3 * Scope 3 temperature
We use a three-step approach which is best demonstrated in the example of Microsoft, below:
1) Temperature Ratings: Scope 1 and 2 = 1.5°C and Scope 3 = 2.0°C
2) GHG emissions in tonnes of CO2e: Scope 1 and 2 = 3,669,965 and Scope 3 = 25,392,426
3) Scope 3 share of emissions: 87% = Scope 3 / (Scope 1 and 2 + Scope 3)
4) Scope 1, 2 and 3 Temperature Rating: (1-0.87)*1.5°+0.87*2.0° = 1.9°C
Microsoft would therefore show for the mid-term:
- Temperature Rating for Scope 1 and 2 = 1.5°C
- Temperature Rating for Scope 1, 2 and 3 = 1.9°C
EXAMPLE: Estimating temperature of La Française Carbon Impact Global Fund
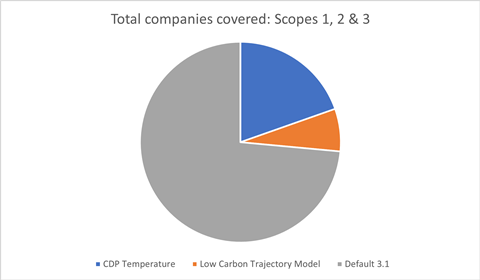
To illustrate how we determine the temperature rating at the portfolio level we’ve chosen the La Française Carbon Impact Global Fund, which held 102 securities as of 31 December 2021. Figure 3 shows the proportion of holdings by different sources of temperature ratings.
Figure 3: Portfolio coverage by temperature methodology
LFAM calculates the portfolio temperature score by aggregating the weighted temperature rating for each holding. The weighting is based on owned emissions (percentage of outstanding shares held by LFAM multiplied by emissions for each holding). The higher the owned emissions, the higher the impact of the respective holding on the portfolio temperature. (For more detail, see the formula for Enterprise Owned emissions weighted temperature score in Table 8, page 25 of the CDP-WWF Temperature Rating Methodology).

The results are as follows:
Coverage:
- 27% of corporate issuers in the portfolio report all three scopes of emissions.
- 73% of portfolio companies lack Scope 3 data and we attribute them a score of 3.1°C.
- 100% of the portfolio in terms of money value.
Portfolio Temperature Scopes 1, 2 and 3: 2.36°C
Top 3 contributors to the Scope 1, 2 and 3 temperature rating:
| Share of portfolio temperature | Company | Temperature of the company |
|---|---|---|
|
19.09% |
Trane Technologies |
1.5 |
|
12.66% |
Stellantis |
2.0 |
|
8.63% |
General Motors |
3.08 |
The column on the left shows the share each issuer has of the overall portfolio temperature. For example, Trane Technologies contributes to 19.09% of the portfolio temperature, which reflects that LFAM’s position in Trane is much larger, as a percentage of the value of outstanding Trane shares, than its equity stake in GM.
The choice LFAM made to aggregate emissions at the portfolio level allows for greater representation of the impact of our own investment decisions on global warming but it creates more volatility in the temperature output of our portfolios. The model would have less volatility if a simple weighted average approach was used (weighting company temperature by holding weight, but not emissions weight) but this would potentially underestimate the contribution of temperature. We have therefore chosen the cautious approach.
The information in this article is as of 31 December 2021 and may not reflect recent updates to the methodology. The information, opinions and figures are considered to be well-founded and accurate as at the date they were established and reflect the convictions of La Française Group. The information included in this document has no contractual value and is subject to change.
Find out how other investment managers and asset owners implemented net-zero commitments in listed equity portfolios in our report, Net zero in practice: Insights from equity investors.


