A carbon footprint is a useful quantitative tool that can inform the creation and implementation of a broader climate change strategy.
What is a portfolio carbon footprint?
A portfolio’s carbon footprint is the sum of a proportional amount of each portfolio company’s emissions (proportional to the amount of stock held in the portfolio). A carbon footprint is a useful quantitative tool that can inform the creation and implementation of a broader climate change strategy.
Why undertake a portfolio carbon footprint?
Measuring the carbon footprint of a portfolio means you can compare it to global benchmarks, identify priority areas and actions for reducing emissions and track progress in making those reductions. There are caveats that carbon footprinting is not yet available for unlisted assets, does not include scope 3 emissions and different estimation methodologies exist. Nevertheless, investors who have already measured the carbon footprint of portfolios say that doing so can improve their own understanding of the portfolio risks and opportunities that climate change presents, gives them answers to stakeholder questions on climate change and allows them to demonstrate publicly their commitment to tackling climate change.
“As we ask more from the companies we invest in, we must hold ourselves accountable for measuring and managing the carbon risk in our portfolio.”
Jagdeeep Bachher, Chief Investment Officer, University of California
Where emissions come from – the system of global commerce
Essentially important to understand for any investor considering portfolio carbon footprinting is where emissions specifically come from. Carbon dioxide is an ongoing outcome from a variety of primarily human activities, but especially from:
- electricity generation;
- energy use in the ongoing functioning and maintenance of buildings;
- modes of transportation;
- industrial processes;
- agricultural process/land use/deforestation.
As a result of ongoing use patterns, greenhouse gas emissions are embedded throughout the functioning of the entire system of global business and society. Ongoing use of energy patterns can be mapped exactly to ongoing production globally and by region. An example of this systemic perspective can be seen in the US as per its energy consumption:
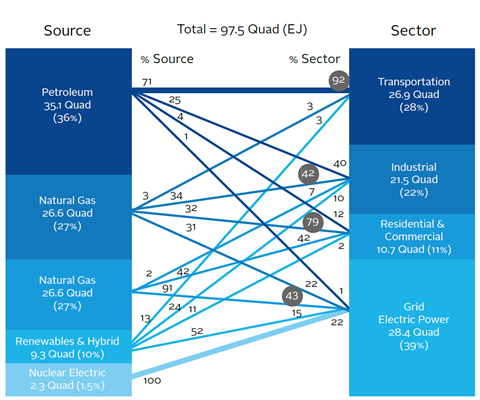
Globally, percentages of energy use and production vary by region, with coal use being the largest proportion in the Asia/Pacific region, while oil and gas are the largest by percentage everywhere else . “Leapfrogging” the developing world on renewable energy then becomes a critical factor for achieving a successful global low carbon transition. Energy use is the majority source of global carbon emissions with agriculture and land use the next most significant cause. Understanding the presently locked in patterns of global production and use are an essential step towards seeing how carbon footprinting can inform investment strategy, as both production and use of energy are arguably of equal relevance to this.
Measuring a portfolio carbon footprint
The most thorough example of measuring the carbon footprint of a portfolio would be measuring the greenhouse gas emissions onsite at particular facilities, getting them verified by reliable external parties and then rolling them up into a single corporate number of absolute production emissions. This could extend across all operations, and to a company’s suppliers and further down the supply chain, all the way to the raw materials procured for use in production processes. Such ongoing production and process emissions can be monitored by software, allowing for a dynamic picture of carbon emissions to be developed.
Equity
Off-the-shelf and customised services exist for measuring an equity portfolio’s carbon footrprint. It may consider not only carbon but also natural capital, fossil fuel reserves and exposure to stranded assets. A carbon footprint is typically constructed by the following steps:
- obtain carbon emissions data on companies or projects owned in a portfolio, either from verified disclosure or from estimated/interpreted sources;
- choose an appropriate benchmark;
- calculate the total emissions of the owned percentages of each company and add them together resulting in a total owned carbon emissions figure per portfolio;
- normalise the results, typically using factors such as annual revenue or market capitalization;
- perform the same calculation on the chosen benchmark, assuming the same dollar amounts are owned of that alternative set of companies – the percentage difference can be expressed as a result;
- further refinements and analysis can be considered within and across sectors and regions.
Fixed income
Providers exist for measuring carbon footprints of fixed income portfolios, though how best to do this is still under development and discussion. The aim is to allocate greenhouse gas emissions according to accounting rules, following the GHG Protocol, and including an ownership principle. If an investor holds both the stock and a bond of a company, emissions can be split to avoid doublecounting. For government bonds, it is possible to compare climate-protecting policies and how they are enforced.
Other asset classes
Measurement techniques are under development in private equity. They are not available easily for unlisted assets, but can be conducted on a best-efforts basis.
Data challenges
Carbon footprint measurements can be cradle-to-gate or cradle-to-cradle:
- Cradle-to-gate means understanding a company’s footprint up to the point it sells a product to a consumer, after which any related emissions become part of their footprint. For example, if Toyota sells a car, the footprint for using the car becomes the purchaser, not the company’s.
- Cradle-to-cradle would consider the whole lifecycle of a product, from sourcing of raw materials, through the use phase, and the eventual disposal.
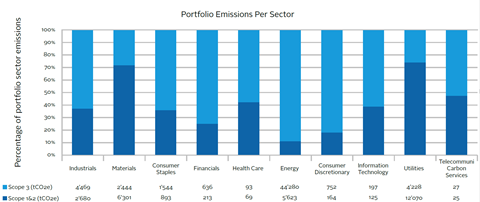
Much of the emissions impact of a product is therefore not captured by cradle-to-gate analysis of the company that produces them. ACCA reported in 2011 that ignoring a company’s indirect emissions, those that fall under Scope 3 of the GHG Protocol (see appendix), can result in 75% of the carbon emissions being missed by analysis.
For example, Ford has completely analysed its business and found that 90% of its footprint comes from the use of its cars and trucks. Therefore the design of its future products, along with the development of new technologies and infrastructure for electric cars and trucks using lower carbon energy, would be a clear relative priority over making improvements to Scope 1 and 2 emissions.
Companies continue to report their greenhouse gas emissions to varying degrees of quality and detail, with some reports being verified by external parties and others not. Companies often do not understand the full nature of their supply chain relationships, even if they did want to report on their Scope 3 emissions (for example, first tier suppliers are understood, but raw material providers may not be, nor all sources of transportation within multiple levels of a supply chain).
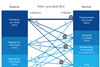
South Pole Carbon calculates the emissions by sector to be vastly different if considering Scope 3 and not:
“While this data is not sufficient to fully understand the carbon risks in our portfolio, we find having some quantitative data valuable, rather than relying entirely on qualitative assessments.”
Bill Hartnett, Head of Sustainability, Local Government Super
Overcoming data challenges
Scope 3 analysis tends to be from estimates such as industry averages, in the absence of measured and verified data. For a comprehensive account of the emissions of any company, it is necessary to combine voluntarily-reported, partially-verified data with estimations across some or all of Scopes 1, 2 and 3, using a variety of modelling techniques. Such approaches include Economic Input-Output Life Cycle Assessment (EIO-LCA) models. Many data providers already integrate some scope 3 using reported data or estimates. The Greenhouse Gas Protocol will produce accounting and disclosure guidance for asset owners by December 2016.
Who is already measuring their portfolio carbon footprint?
Measuring portfolio carbon footprints is now roughly ten years old, dating back to Henderson’s June 2005 How Green is my Portfolio? and The Carbon 100 report. In the case of this first Henderson footprint, the Henderson Global Care Income Portfolio was found to be 32% lower carbon than its chosen FTSE All-Share benchmark at the time. Investors measuring their carbon footprint today include Green Century, Calvert, Pax World and signatories to the Montreal Carbon Pledge. In May 2015, the French government voted to amend article 48 of The Energy Transition Law and to require institutional investors (insurance companies, public institutions and public pension funds) to report on risks arising from climate change and GHG emissions associated with assets owned.
Using a portfolio carbon footprint
A portfolio carbon footprint improves understanding of emissions in the portfolio for equities and fixed income, and can be used as a tool for engaging with fund managers and companies on climate change risks, opportunities and reporting. It can also be used as a tool to inform further action, including emissions reduction. However, it needs to be complemented by discussion with portfolio managers and companies, particularly where data is less reliable.
Asset owners using portfolio carbon footprinting to inform actions include:
- Dutch healthcare pension fund PFZW, has committed to increasing sustainable investments four-fold, to at least €16 billion, while reducing the carbon footprint of its entire portfolio by 50% by 2020. Sustainable investments will include direct investments in green energy, clean technology, sustainable climate-related solutions, food security and against water scarcity. The footprint will be halved by comparing companies in each sector and picking the best performers, using data from four service providers.
- ASN Bank has worked with Ecofys to develop a Carbon P&L methodology. This Carbon P&L concept attempts to proportion out lower carbon investments (the P of their P&L) versus traditional emissions intensive investments (the L side of the ledger) with a goal of balancing this ledger by 2030. ASN are also driving a coalition to make similar commitments.
- The Environment Agency Pension Fund and Local Government Super use carbon footprints to inform priority engagement with companies, including on emissions disclosure and performance.
- The Environment Agency Pension Fund works with its corporate bond managers and Trucost to monitor the total environmental footprint of its corporate bond fund. Analysis identifies bonds linked to high-impact activities, and, where practical, these are replaced in the portfolio where another bond can meet the same portfolio needs but with less impact.
Download the full report
-

Reducing emissions across the portfolio
May 2015
Reducing emissions across the portfolio
- 1
- 2
- 3
- 4
 Currently reading
How measuring a portfolio carbon footprint can help