| ORGANISATION DETAILS | |
|---|---|
| Name | Wellington Management Company, LLP |
| Signatory type | Investment manager |
| Region of operation | Global, North America, EMEA, Asia Pacific |
| Assets under management | €915bn |
| COVERED IN THIS CASE STUDY | |
|---|---|
| Name of fund | Wellington Management Climate Strategy (UCITS) |
| Asset class | Equity |
| Geography | Global |
| Sector | Diversified, unconstrained sector and geographic exposures, emphasis on climate solutions. |
| Environmental objective | Mitigation and adaptation |
| Economic activity | All (NACE Macro sectors) |
Wellington endorses the objectives of the taxonomy and is keen to deliver workable solutions and investment performance for clients. We believe enhancing transparency among corporates and asset managers will increase and improve sustainable investments. As all parties strive for comprehensive implementation, we are optimistic we will see increased clarity for both sustainability challenges and systemic risks to the economy. Ultimately, the taxonomy and its regulation will improve dialogue with issuers, companies and clients.
Other aspect you would like to mention?
We did not see plans for implementing climate adaptation measures among portfolio companies. Therefore, we defined adaptation as activities that eliminate or substantially reduce physical risks associated with climate change, either for customers consuming products or for services provided by portfolio companies. We only considered revenue alignment (not capex or opex) and did not identify companies investing heavily in climate change mitigation or adaptation. Most companies in the portfolio enabled customers to mitigate CO2 emissions and/or build resiliency to physical risks associated with climate change.
Taxonomy implementation
We initially defined elements that could be automated and those which required manual input and review. We then estimated eligibility by automated mapping of revenue categories to NACE macro sectors and environmental objectives.
We applied our own mapping to measure eligibility at the revenue sector level, based on a generic mapping of BICS and RBICS revenue categories to NACE macro sectors and taxonomy eligible business activities. We then manually reviewed alignment percentages where there was some ambiguity or where metrics and thresholds required testing.
We examined the rationale for the revenue alignment estimate for each company and took account of guidance around climate engagement from ESG research and the Woods Hole Research Center. We recommended direct engagement with management teams to resolve questions. We relied on the same sources for the Do No Significant Harm (DNSH) review and minimum social safeguards analysis, leveraging annual and sustainability company reports, CDP reporting, carbon metrics, electricity generation mix data, and ESG data and research reports.
We determined that the DNSH test refers to categories of likely negative contribution from the taxonomy technical annex and its final report, and relates largely to environmental impacts, while the minimum social safeguards test is more focused on social issues and human rights.
We largely conducted manual DNSH and minimum social safeguards tests at this initial stage, though we used basic screens and controversy reporting to provide an automated response to determine where businesses faced a higher level of risk and were likely to have revenue disqualified having failed to meet one of the criteria.
Principles, criteria, thresholds
We conducted generic mapping to determine eligibility of specific revenue segments and then studied individual businesses, segment-by-segment, to determine conceptual alignment. We used available segment data to verify compliance with metrics and thresholds and estimated an alignment percentage. We then carried out a manual review of each revenue division, which enabled us to distinguish between generic category labels and actual company activities and product lines.
An example is the case of a solar power generation company with a lack of comprehensive reporting on revenue division carbon metrics or GHG protocol product lifecycle standard-compliant product carbon footprint assessments. However, if we were reasonably confident that the lifecycle impact was consistent with the declining threshold of 100g CO2e/kWh, we applied a 100% alignment to that revenue division.
Do no significant harm assessment
We assumed no violations of the DNSH test unless we identified a significant environmental controversy or a bottom quintile environmental score.
For example, we reviewed and reported a company’s revenue from solar power generation. If subsequently we did not find evidence that biodiversity and ecosystem objectives were likely to be adversely affected by the company’s products and services, we did not change the revenue alignment estimate. However, where we identified a clear and significant environmental damage impact or controversy, we reduced or disqualified the portion of aligned revenue estimate accordingly. We carried out DNSH screens comprehensively, regardless of the aligned revenue estimate, and recorded this percentage separately as this was useful to determine when significant harm was the result of a company’s activities regardless of the significant contribution estimate.
Social safeguards assessment
We assessed minimum social safeguards by reviewing internal proprietary ESG scores and analysis, including company engagement meetings and proxy voting comments. We also leveraged external ESG data, research reports and controversy flags, as well as the UN Global Compact (UNGC) list.
For companies with significant social violations or controversies, we undertook additional research to determine whether the controversy was sufficiently severe (acute impact on multiple site locations or large number of individuals) to warrant exclusion from our aligned revenues calculation. We also considered whether the controversy had taken place within the past three years and if it had been resolved.
Though two companies in the portfolio were on the UNGC watch list, we determined that outstanding issues could be addressed through engagement and review and were not sufficient cause to invalidate our assessment of aligned revenue. Where we flagged a significant controversy, we reviewed the engagement process and proprietary research sources and determined eligibility on grounds of potentially failing minimum social safeguards. If a company failed UNGC criteria, we invalidated any aligned revenues.
Generally, controversies and adverse impact data were related to the whole company rather than an individual revenue division. This mismatch was an analytical challenge.
Turnover/capex/opex alignment
When we considered a company as likely to be making a substantial contribution to climate change mitigation or adaptation, we estimated the percentage of revenue derived from contributory business activities or divisions. Where a company or issuer had a climate change adaptation plan, we considered the opex or capex dedicated to its implementation. However, this was not the case in the analysis of this portfolio, probably because the focus of its strategy was on companies that deliver climate change solutions rather than those that invest in making their own operations ‘greener’.
Additional comments
Our longstanding strategy, which pre-dates the taxonomy, has been to invest exclusively in companies that derive a majority of revenues from products and services that contribute directly to climate change mitigation or adaptation.
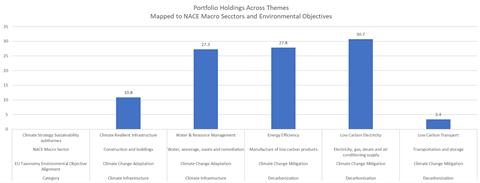
Given that this strategy focuses on decarbonisation and adaptation, we expected a high degree of taxonomy eligibility. We mapped most portfolio holdings to themes that align with the NACE macro categories - Graph 2 shows the distribution of holdings across our five sustainability categories and the NACE Macro categories.
Though most companies within our climate investment framework focus on climate solutions, we saw significant variance in revenue alignment estimates due to differing interpretations of taxonomy metrics and thresholds. Indeed, inconsistencies across data providers and differences in data availability (dependent on company size and location) were also likely to result in significant alignment variance.
Alignment results
Based on a Bloomberg screen the weighted average eligible revenue was 72.6% as of 12/31/2019.
We estimated 36.3% alignment based purely on revenue and a generic probability of alignment for each division (RBICS) label. When we focused on company revenue divisions, and specific products and services, we estimated a weighted average revenue alignment of 51.7%. In most cases, a lack of sufficient data meant determining compliance with metrics and thresholds for individual activities was challenging.
| Source | Eligibility | Weighted average revenue (% alignment) |
|---|---|---|
| Bloomberg | 72.6% | |
| WMC generic mapping | 36.3% | |
| WMC manual review | 51.7% |
The primary driver of a higher alignment estimate after a specific company review was unconventional business models in categories such as real estate (Hannon Armstrong Sustainable Infrastructure). Where a company’s activities were not eligible under either Bloomberg or our own coding, such as “commercial real estate”, the automated calculation was 0% eligibility. Hannon Armstrong, however, is a Real Estate Investment Trust (REIT) that invests exclusively in sustainable infrastructure, either directly mitigating CO2 or improving infrastructure resiliency. Reporting on each project in the portfolio was robust, and we estimated 100% alignment for this company based on our manual review and engagement with the company management team.
The breakdown of all revenues was approximately 60% of holdings contributing to mitigation and 40% of holdings contributing to adaptation. However, when reviewing aligned revenues more narrowly, the vast majority were contributing to mitigation; mainly low-carbon electricity and energy efficiency. We attributed the lower share of aligned revenues to a lack of clarity and insufficient data to demonstrate compliance with metrics and thresholds for the adaptation criteria.
Several activities seemed to overlap across mitigation and adaptation, while intersecting with activities for which full guidance has not yet been issued. Both our generic mapping and company specific analysis resulted in mitigation (own operations, enabling, transition) and adaptation categorizations (own operations – “adapted”, enabling). This type of analysis has historically been conducted primarily at the corporate entity level, rather than the revenue division level, and at times cases of potential double counting have come to the fore, where an infrastructure improvement activity has had both clear mitigation and adaptation contributions. It was not entirely clear what the distribution across the various categories should be, even when examining an individual company’s operations.
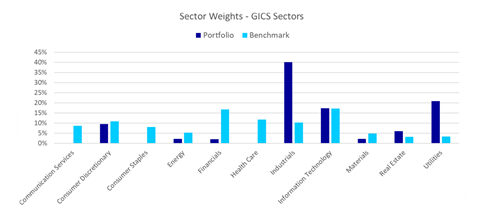
1. Distribution by GICS sector vs MSCI ACWI – the portfolio tends to have a heavy utilities and industrials footprint, relative to the MSCI ACWI Index

2. Mapping of climate strategy themes to NACE macro categories and holdings across themes

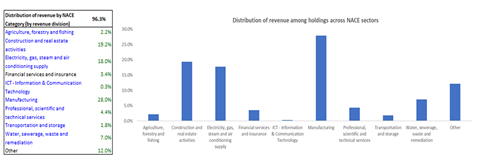
3. Distribution by NACE macro category

Challenges and solutions
| NO. | CHALLENGE | SOLUTION |
|---|---|---|
| 1 | Uneven clarity of metrics and thresholds, differing interpretations of the same data and lack of clarity on boundaries for DNSH and minimum social safeguards. |
We relied on our own assessment of conceptual alignment and estimates where we were unable to document metrics and thresholds for specific activities. Differing regional standards may amplify variations in data availability and interpretation. We established what we considered an achievable standard for a small number of portfolios, carrying out a basic scan of controversies and undertaking additional manual research across qualitative sources. |
| 2 | Lack of comprehensive solutions from data providers. | We leveraged Bloomberg analysis, MSCI’s ESG data, CDP reports, the UNGC list, proxy data and direct company engagement to supplement company disclosure. |
| 3 | Conceptual alignment with differing interpretations of substantial contribution to adaptation solutions – distinction between first and second order climate challenges | We recorded cases where we identified solutions to climate adaptation for activities that did not meet the screening criteria, but where we believe substantial contribution existed (for example, biotech research or vaccines manufacturing to address risk of disease spread that may be exacerbated due to climate change and extreme weather events). |
Recommendations
When there is more corporate transparency of the positive contributions and negative impacts of business activities by division, it will be easier for investors to make allocations and for fund managers to include companies in a portfolio or opportunity set.
Forward-looking targets and aspirations, ideally in as standardized a form as possible (e.g. CDP, TCFD reporting and other common metrics), can be instrumental in discerning an environmental or sustainability investment case. Clarity of standards for application and reporting will be critical to facilitate implementation, demonstrate relevance to asset owners, secure longer-term adherence and ultimately impact on environmental outcomes.


