| ORGANISATION DETAILS | |
|---|---|
| Name | Swedbank Robur |
| Signatory type | Investment manager |
| Region of operation | Sweden |
| Assets under management | €130bn |
| COVERED IN THIS CASE STUDY | |
|---|---|
| Name of fund | Swedbank Robur Transition Sweden |
| Asset class | Equities |
| Geography | Nordic Region |
| Environmental objective |
Mitigation and adaptation |
| Economic activity |
|
The EU Taxonomy will impact the investment community in many ways. However, it is primarily a tool that will facilitate capital allocation to environmentally sustainable activities, enabling investors to identify and respond to opportunities. As such, the taxonomy will be an important driver of sustainable transformation in the real economy.
As a company with a strong focus on sustainability and climate, we attach great importance to implementing the taxonomy, which will boost our knowledge and help us assess sectors and companies. Engagement around the taxonomy is also an opportunity to highlight the significance of the framework to our investees.
Other aspect you would like to mention?
We selected holdings within different sectors to obtain a broad understanding of the taxonomy framework.
Taxonomy implementation
Principles, criteria, thresholds
The process of identifying the taxonomy-aligned percentage based solely on the substantial contribution criteria comprised four steps.
First, we initially mapped company business lines to taxonomy eligible activities. We used external data (e.g. Bloomberg revenue breakdown and green revenues) and held discussions with the designated portfolio manager. We then conducted a detailed assessment based on publicly available information, from which we arrived at an initial taxonomy-aligned figure. We engaged with companies to obtain feedback on the methodology and insight into their activities. We also discussed their future plans on reporting and corporate strategy.
Finally, we assessed the companies’ taxonomy alignment based on contribution criteria.
Do no significant harm assessment
We conducted a brief overview around DNSH. Certain criteria were identified during our initial assessment and then discussed with companies during the engagement stage. We found the criteria overly detailed, adding complexity to an already challenging task. We determined that a number of companies met these criteria through existing sustainability work. However, other companies found demonstrating alignment or meeting the criteria quite challenging. We feel a more thorough assessment would be required to reach more comprehensive conclusions.
Social safeguards assessment
The social safeguards assessment was not specifically in the scope of this case study. Generally, Nordic companies in scope have high standards on social sustainability that surpass the criteria set by the taxonomy, which are often based on EU legal criteria. However, some high-risk sectors were in scope, including construction and mining, so a social safeguards assessment was important.
Turnover/capex/opex alignment
Our process is described in the section on principles/criteria/thresholds. We mainly targeted turnover-based taxonomy alignment, with assessments often based on revenue breakdown for the previous fiscal year. In certain cases, we used approximations and simplifications; for example proxies were used to estimate turnover. Examples include the market value of assets, internally booked revenues, and gravimetric share of material from low-carbon processes.
During the engagement process, we discussed capex and overall corporate strategy, in particular the difference in companies’ taxonomy scores between capex and turnover. We also examined the use of sustainability bonds as potentially high-scoring capex-based instruments.
Additional comments
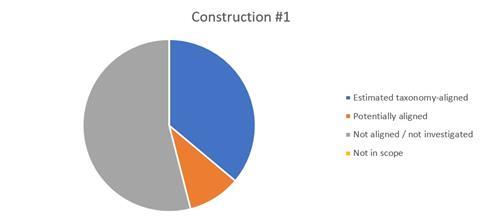
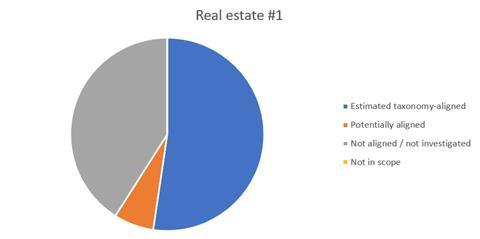
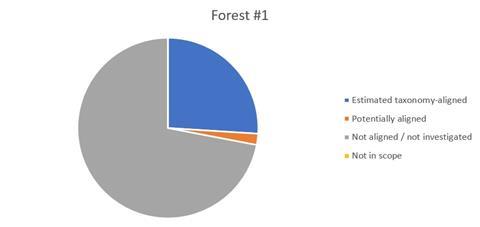
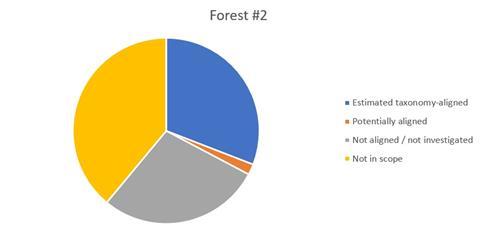
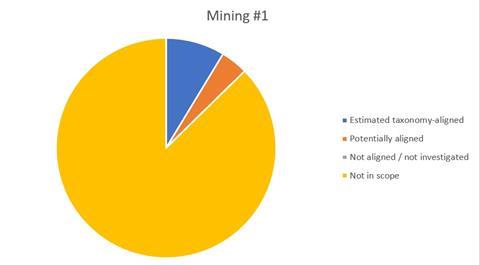
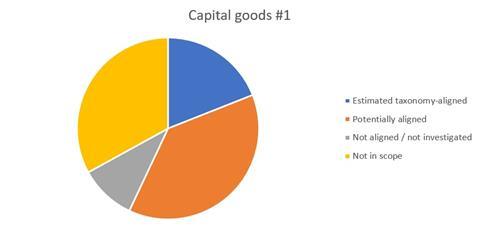
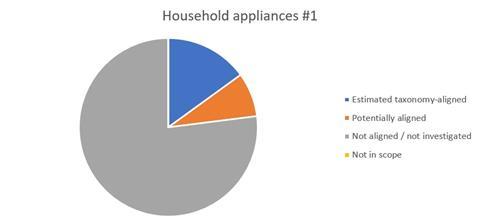
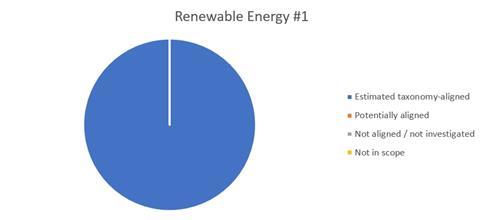
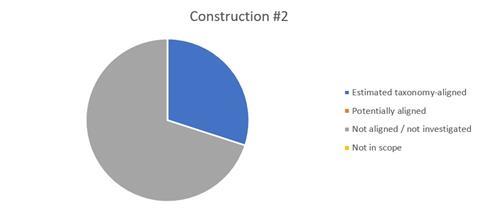
We estimated taxonomy alignment, or potential alignment where data was incomplete and/or when the company could not provide required information, such as the connection of a specific activity to a revenue stream. Alongside the initial mapping of taxonomy-eligible activities, we categorised companies’ turnover as: estimated aligned, potentially aligned, not in scope of assessment, or not in scope (not taxonomy eligible). We generally adopted a cautious approach when estimating aligned revenues.
Alignment results
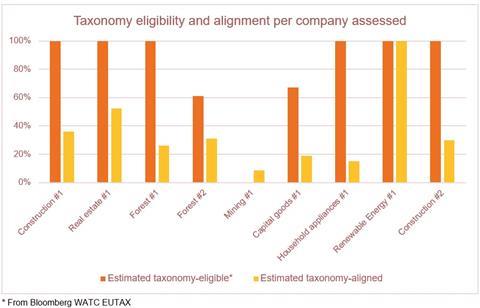
The main business operations of the companies in our study fell within four of the taxonomy macro- sectors. When applying the taxonomy thresholds, we found that the level of complexity differed substantially between sectors and underlying economic activities. As we selected companies expected to have taxonomy-aligned revenues, we saw relatively high scores (average 35%) for estimated aligned revenues (see graphs below). Companies that were not in scope but invested in the target fund were expected to have significantly lower taxonomy eligibility. Strong ESG- performing companies did not necessarily have high taxonomy scores or activities in scope of taxonomy sectors (taxonomy eligible). Company public disclosure was often not detailed enough, or was structured in a way that precluded proper assessment of the taxonomy criteria. Though most companies had initiated internal projects to map their business activities against the taxonomy, many of them had yet to prepare sufficiently for the upcoming reporting requirements. Companies found it challenging to interpret and then apply the criteria to their multiple product lines, regions, etc. Indeed, it may be necessary to introduce new reporting methods and systems to generate the information required to verify taxonomy alignment. In terms of disclosure, companies requested investor input on level of detail and type of information.
Challenges and solutions
| NO. | CHALLENGE | SOLUTION |
|---|---|---|
| 1 | Incomplete information in company reporting. | Researched company website for complementary statements to official reports and engaged directly with company |
| 2 | Companies did not have sufficient data to assess compliance with the technical criteria. | Engaged directly with company and made estimates of reasonable compliance for companies that had data partially complying with the technical criteria. |
| 3 | Difficult to interpret certain criteria; insufficient guidance in the taxonomy. | Engaged directly with company to find a “best way” solution. |
| 4 | Relative thresholds not defined by market standards and vary between geographies. | Engaged directly with the company; advocated baseline benchmarks to assess what levels should be applied as thresholds. |
| 5 | Taxonomy was very technical. | Company and sector specialist engagement, alongside industry research. |
| 6 | Insufficient guidance on whether to assess alignment according to revenues, capex or opex. | In general we used revenues as an equity approach, but we recognise that for some companies a cash flow or even a balance sheet approach may be more suitable to assess level of alignment of company activity. |
| 7 | Difficult to prove substantial mitigation for activities where tangible criteria did not exist. | For example, many activities could qualify under manufacture of low-carbon technologies. The approach we took was to engage with the company, though there were no clear results. |
| 8 | Difficult to prove substantial mitigation without existing life cycle assessments on a network level; including tracking the use of products sold further down the value chain. | Engaged directly with the company. |
Recommendations
Our main recommendation is to adopt a bottom-up (rather than a top-down) approach to make fair assessments of taxonomy alignment. We found it relatively simple to make top-down assessments and use quantitative approaches to assess whether companies were taxonomy eligible, as this could be determined through mapping of industry codes. However, a bottom-up approach was required in order to assess taxonomy alignment, since there was insufficient data and company reporting to enable a top-down approach. Direct engagement with companies was important to understand how the business complied with the taxonomy.


