| ORGANISATION DETAILS | |
|---|---|
| Name | MN |
| Signatory type | Investment manager |
| Region of operation | Global; based in the Netherlands |
| Assets under management | €154bn |
| COVERED IN THIS CASE STUDY | |
|---|---|
| Sector | Commodity chemicals, residential real estate, integrated utility manufacturing |
| Geography | Europe, US |
| Asset class |
Fixed income – corporate equities |
| Environmental objective | Mitigation and adaptation |
| Economic activity | All |
The EU taxonomy can help show which eligible economic activities are environmentally sustainable and reflect a shift in the regulatory understanding of ’sustainable investing’ from risk mitigation to positive contribution, offsetting concerns over “greenwashing”. This may drive further allocation of capital to positive impact and Paris-aligned investments. However, integrating the taxonomy into less specialised product strategies will only be feasible in the longer term and if embraced by corporates.
Mapping companies’ revenues to taxonomy-defined economic activities and criteria is challenging as data availability remains low. For a qualitative portfolio application of the taxonomy, both specialised sector knowledge and a significant time commitment is necessary. For pension funds with largely passive allocations this poses a particular burden. Overall, we believe taxonomy alignment reporting should only be required for product strategies with explicit ESG objectives, such as those with a better ESG score than the benchmark, or those that focus on carbon reduction.
Taxonomy implementation
Principles, criteria, thresholds
We leveraged Bloomberg data to map eligible sectors to the taxonomy activities using the Excel sheet provided by the Technical Expert Group (TEG). Where mapping was incomplete, we used the TEG report annex. We then searched for other possible alignment activities, including revenues that were not flagged as eligible by Bloomberg but appeared highly aligned with the principles of the taxonomy. When we could make a logical link, such as plastic production for LyondellBasell (LYB), we deviated from the activities directly linked to the company’s sector, and added others.
Where detailed revenue breakdown was not available, we made potentially unrealistic assumptions that all products were produced equally. Indeed, companies’ economic activities might have higher eligibility if revenues were broken down and reported at a lower product level. In our view, therefore, it is not presently possible to make an accurate portfolio alignment report.
Do no significant harm assessment
Again, we looked to identify data points in the taxonomy annex. In most cases the Do No Significant Harm (DNSH) criteria referred to water, circular economy, pollution and ecosystem controversies.
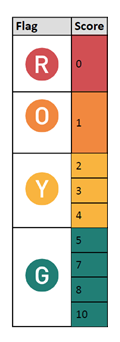
We relied on proxy data and used MSCI ESG controversies, with the threshold that companies could not have a flagged score lower than green.
Social safeguards assessment
We did not consider it essential to include minimum safeguards in the assessment. As shown by the exclusion of poor performers in the DNSH check, assessed holdings already exceeded the minimal threshold set by MSCI ESG ratings. Nevertheless, we did consider whether assessed holdings were Global Compact violators.
Turnover/capex/opex alignment
It was challenging to measure revenue alignment, due to a lack of detailed corporate reporting. Therefore, we made simple assumptions, such as weighting product revenue equally or not differentiating product segments.
The use of turnover or capex made a significant difference in the case of Enel, as the company is in transition to reduce thermal generation and switch to renewables. Current revenue is not notably aligned, though alignment is much higher when using capex. We suggest that both should be reported.
LYB only reports the CO2 intensity of certain groups of chemicals. We had to estimate in many cases as the chemicals mentioned under CO2 intensity, identified in Carbon Disclosure Project (CDP) , did not map with the chemical groups in the annual report. Moreover, the company groups many chemicals under ‘Other base chemicals’.
As it was challenging to measure Vesteda’s price elasticity of demand (PED), we used energy labels. However, similar to most of the sector, Vesteda does not report on revenues deriving from properties based on their label. Therefore, we looked at the percentage of homes with an energy label A.
Alignment results
For detailed results of our fixed income case studies, refer to templates attached in the annex.
How company activities are mapped to taxonomy-eligible activities greatly impacts which are investigated for further assessment. Therefore, accurately determining the eligibility of companies’ economic activities is essential. We assumed that data providers translating NACE codes to other classifications used by the financial services industry (BICS, GICS) would be fully transparent about the way this has been carried out and the choices made.
Subsequent to the identification of EU Taxonomy eligibility, we believe that detailed reporting and clear guidance are critical in evaluating substantial contribution to climate change mitigation and adaptation, as well as to the DNSH criteria. As both are currently lacking, the evaluation is very time intensive. If this issue is not addressed, we expect implementing the EU taxonomy will only be possible on a qualitative basis.
Detailed results of our fixed income case studies
LyondellBasell
Bloomberg data shows 78% of the portfolio was taxonomy-eligible. Only the refining (oil refinement) & marketing business was not eligible. Other activities included basic (plastic production) and speciality chemicals, and these could be linked to “manufacture of organic & inorganic basic chemicals”, a taxonomy-aligned activity. We also considered “manufacture of plastics in primary form” as a taxonomy-aligned activity relevant to LYB; hence its inclusion. We examined the chemicals the company produces and allocated them according to the taxonomy categories. The calculation of the average CO2 intensity of the whole company was based on data provided by CDP and compared to the industry average (the industry being all chemicals within our own benchmark). As LYB has a higher CO2 intensity than the industry average, and has no science-based targets, the full 78% cannot be taxonomy-aligned. We then weighted the different chemicals against their intensity threshold. If they were below both the threshold and the industry average, then the revenue percentage of that product was considered as taxonomy-aligned. This was the case for 36% of the chemicals (polymers and high value chemicals). No alignment could be made for the “manufacture of plastics in primary form” as they are not made from renewable feedstock. We did not identify any DNSH controversies, so there was a 36% alignment overall.
Eligibility (78.1%)
Active in the following sectors::
- Refining and marketing (21.9%) - BICS 131014 not eligible
- Basic and diversified chemicals (62.5% )- BICS 171011 eligible
- Specialty chemicals (15.6%) - BICS 171012 eligible
EU taxonomy categories
- Basic and diversified chemicals - manufacture of organic and inorganic basic chemicals
- Specialty chemicals - manufacture of organis and inorganic basic chemicals
| C02 intensity per product | Required intensity by taxonomy | Segment | Omzet % | ||
|---|---|---|---|---|---|
| Source: CDP, 2019 LyondellBasell Annual Report | |||||
| Polymers | O&P - PE (17%) en PP (14%) subsegment | 31% | |||
| Emissions intensity (C02e) | 0.091 | 0.512 | aligned | ||
| Steam cracking (HVC) | |||||
| Emissions intensity (C02e) | 0.787 | 0.702 | not aligned | ||
| Methanol (HVC) | I&D (20%) - Oxyfuels & related products | 5% * | |||
| Emissions intensity (C02e) | 0.236 | 0.702 | aligned | ||
| Ethanol | I&D - Oxyfuels & related products | 5% * | |||
| Emissions intensity (C02e) | 0.064 | 0.702 | aligned | ||
| Butadiene (HVC) | |||||
| Emissions intensity (C02e)Aromatcs | 0.684 | 0.702 | aligned but above industry average | ||
| Aromatics extraction | I&D - Oxyfuels & related products | 5% * | |||
| Emissions intensity (C02e) | 0.092 | 0.0295 | aligned | ||
| Other base chemicals | |||||
| Emissions intensity (C02e) | 0.57 | not aligned , above industry average | |||
| DNSH: 74% water stress according ot MSCI. Irreducible | 36% aligned | ||||
Vesteda
Bloomberg data showed Vesteda was 100% taxonomy-eligible, as the company is active in residential real estate which matches with the taxonomy activities of building renovation, construction, acquisition and ownership of buildings. It was very difficult to measure the company’s PED for a number of reasons.
First, the question of local stock was challenging, so to measure it more easily we classified it on a country/regional level (western Europe). Indeed, our universe would be too small to compare Vesteda if we only used country level (smaller real estate companies have very little data).
The city and regional levels were also extremely difficult to measure, because most companies do not report detailed data: Companies rarely report the square meterage (M2) of the properties they own; while they report the Kwh of their properties, they do not differentiate between residential and retail or office properties, which use considerably more energy.
In addition, it is challenging to estimate M2, given it differs by city and country, and it would be difficult to dive deep into the property locations for each individual company as they usually own more than 20,000 units. Energy labels were a more viable alternative.
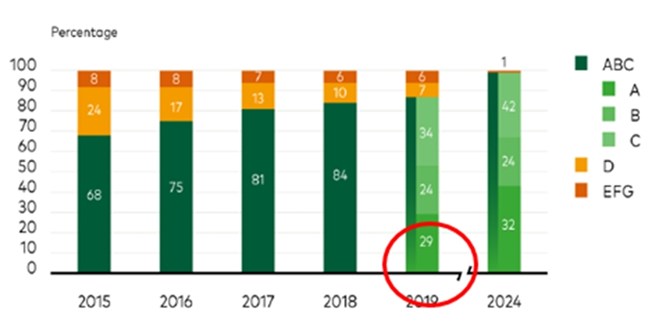
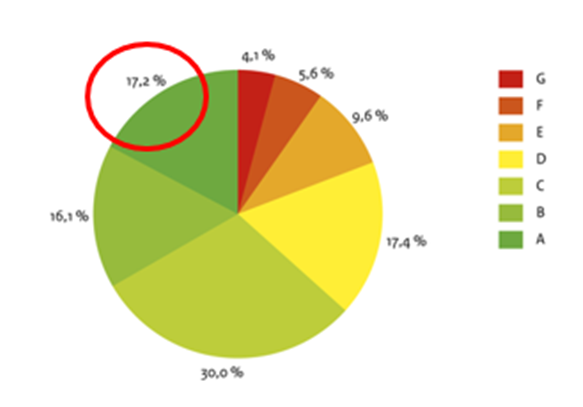
As Vesteda is only active in the Netherlands, the distribution of energy labels within the country was used for comparison, with those in the top 15% of the local stock (the Netherlands) considered taxonomy-aligned. Some 29% of Vesteda’s properties have an A label - the highest possible - compared to 17.2% in the Netherlands overall. As this is very close to 15% and is the highest label, we would give Vesteda an alignment percentage of 29%.
Energy label development 2015-2024
Source: Vesteda Residential Fund, 2020
29% taxonomy alignment
- 17.2% Dutch households have A label –> highest
- Given a house can’t obtain a higer rating and 17% is very close to 15%, it is fair to allocate 29% to Vesteda
Label distribution homes, 2007-2018
Source: RVO
Enel SpA
Bloomberg data shows 27% of the company was taxonomy-eligible, corresponding to its networks (transmission) businesses. However, we would argue that 38% is taxonomy-eligible, taking account of their renewables business. As Bloomberg does not distinguish between thermal and renewable activities, alignment was measured as per activity:
- Electricity Generation: Renewable CO2e is generally at such low levels (8gCO2/Kwh) that it can be taken that all activities (hydro is usually the largest emitter, but in this case it is the biggest source) contribute to reduce life cycle emissions to below 100g CO2/kwh. While the taxonomy refers to scope 1 emissions having to reach net zero by 2050, it also includes scope 2, which is the largest source of CO2 for Enel. Emissions per renewable type were not available and it was not possible to link gas, as no CO2 data was available for gas alone. Further, it is unlikely gas will be within 100gCO2/Kwh inside five years, because the current goal for the whole group, including renewables, is to achieve a reduction to 215gCO2 Kwh. Therefore, all normal generation will exceed this figure. Renewables account for 10% of revenue and 43% of capex, and are taxonomy-aligned.
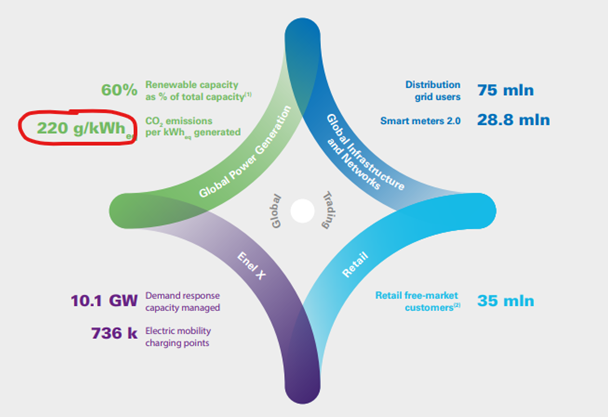
- Transmission: The transmission business is eligible if (1) more than 67% of newly connected generation capacity in the system is below the generation threshold value of 100gCO2e/kWh, measured on a product carbon footprint (PCF) basis over a rolling five-year period; or (2) the average system grid emissions factor is below the threshold value of 100gCO2e/kWh, measured on a PCF basis over a rolling five-year average period. As the company’s aim is to reduce emissions to 220g/kwh by 2022, and the current average emissions factor of the grid is 418gCO2e/kwh, it is not eligible. However, transmission grid activities are eligible irrespective of whether the system is on a pathway to full decarbonisation if there is direct connection of low carbon emission generation, EV charging points and infrastructure, all with the goal of increasing the generation of renewable energy. Enel is active in all these activities but it is not possible to link a percentage of revenue or capex to that specific segment, hence the 0% alignment.
- Enel’s electricity infrastructure business is called Enel X. A link can be made with Enel X as an enabling alignment source, as it allows clients to use technology to transform energy into new opportunities for growth and progress. For example, using smart lighting, smart grids and EV charging, as well as equipment to exchange renewable electricity between users, such as smart meters and grids. Enel X is active in all these areas, as well as in others that are not taxonomy-aligned, such as microfinance. Nevertheless, the majority of their activities are aligned. Taking this together with the fact that a lot of transmission activities do not contribute to alignment, though they should, we considered all turnover and capex from Enel X as aligned. This corresponded to 1% for revenue and 3% for capex.
Overall, this means 11% of the company is aligned based on revenue, and 46% based on capex.
Main now financial indicators 2022
Source: Enel Annual Report. 2019
Challenges and solutions
| NO. | CHALLENGE | SOLUTION |
|---|---|---|
| 1 |
Detailed reporting required from firms. |
We made simple production assumptions using product catalogues. |
| 2 |
Eligibility seemed to depend on the mapping route (translation made between different industry classifications). |
We translated BICS, provided by Bloomberg, to NACE (indirect mapping). |
| 3 |
Mitigation/adaption criteria were at times open to interpretation, therefore the evaluation is qualitative. |
This shows the dependence on bottom-up company knowledge. |
| 4 |
Integrated utility: The additional criteria mentioned for NACE macro-sector D were very technical and difficult to measure without information from the company itself. |
In most cases, we disregarded these criteria. |
| 5 |
Integrated utility: Should investors prioritise capex or revenue alignment? |
As revenue looks at current performance while capex looks at potential performance, we reported both. |
| 6 |
Residential real estate: Local stock gives companies too much flexibility in selecting which of the building stock offer the highest alignment. |
Given the lack of detailed data, we leveraged the broadest and most easily measurable data. |
| 7 |
Residential real estate: What are the thresholds for DNSH? It only refers to lack of resistance to extreme weather, excessive water consumption and presence of asbestos? When do we claim a property has a lack of resistance, uses too much water, or does not handle asbestos well? |
We made the assumption that a developed country such as the Netherlands has sufficient regulation in place to ensure properties are built to be sustainable, in terms of their robustness and water use, while asbestos is only a concern if the company does not address the issue. |
| 8 |
Commodity chemicals: Flexibility in using NACE classifications that are not mapped with the company’s activities |
We adopted a flexible approach and looked at the whole C-manufacturing sector. |
| 9 |
Commodity chemicals: Company can selectively group certain chemicals together to show a lower CO2 intensity. |
We were conservative in measuring the percentage of revenue assigned to the chemical groups. |
| 10 |
Commodity chemicals: The chemical groups are defined very broadly. Ethylene is mentioned in the taxonomy, but does this include polyethylene? |
We included all chemicals that shared the compound mentioned in the taxonomy. |
Recommendations
For ’integrated utility’ we divided the company into the different components of the utility, such as generation and transmission & distribution, as this made it simpler to categorise potential alignment. Given the size and diverse nature of the portfolios of ’residential real estate’ companies, it was very difficult to compare their energy intensity. The use of energy labels was more feasible, though they cannot always be linked to revenue or capex. In these cases, simply providing the percentage of homes with a high energy label may suffice. Conducting a deep dive for the different types of ’commodity chemicals’ was essential to get a steer on how they can be allocated to the different activities in the taxonomy. It is worth being flexible in assigning chemicals and not be limited to the activities that map to the company’s industry classification.


