| ORGANISATION DETAILS | |
|---|---|
| Name | La Financiere de l’Echiquier |
| Signatory type | Investment manager |
| Region of operation | Europe |
| Assets under management | €9.6bn (as of 30/06/2020) |
| COVERED IN THIS CASE STUDY | |
|---|---|
| Name of fund | Echiquier Positive Impact Europe |
| Asset class | Equities |
| Geography | Europe |
| Environmental objective | Mitigation and adaptation |
| Economic activity | All |
La Financière de l’Echiquier has been involved in responsible investment for more than ten years and currently manages six Socially Responsible Investment (SRI) funds. We also manage other funds within an ESG integration strategy and as responsible asset managers we strive to understand, implement and comply as quickly as possible with new standards and obligations.
Other aspect you would like to mention?
The fund’s exclusion policy encompasses a wide range of sectors, particularly fossil fuels.
Taxonomy implementation
Principles, criteria, thresholds
To gain a good initial understanding of company activities, we examined annual and financial reports and determined the split in turnover by segment/activity. We then carried out a Bloomberg screening via the NACE code to assess which company activities were aligned with the taxonomy and which may be eligible. We compared the Bloomberg results to our own knowledge of the company. When a company was involved in an activity covered by the taxonomy, we carried out a data search via their disclosures. From this process we estimated percentages for alignment and eligibility. However, we were very conservative in our assumptions when no data was available. For example, for a semiconductor company, where no end-market data was available (particularly renewables) we made the assumption that while no turnover was aligned with the taxonomy, some may have been eligible.
Do no significant harm assessment
We used MSCI environmental controversies grading, adopting orange as the threshold: green and yellow were accepted; orange and red were considered as doing significant harm.
Our exclusion policy includes fossil fuels, weapons, controversial weapons, Genetically Modified Organisms (GMO), tobacco and United Nations Global Compact (UNGC) violations.
Social safeguards assessment
We used MSCI Social Controversies grading, adopting red as the threshold: green, yellow and orange were accepted, while red was rejected. Only one company in the portfolio, Unilever, was flagged orange for this criteria. We decided to internally assess the severity of this controversy.
Turnover/capex/opex alignment
As data availability around company activities was initially a significant challenge, we decided not to examine Capex/Opex taxonomy alignment. However, if our portfolio had oil companies striving to develop renewable installations, for example, we would have considered Capex/Opex.
Additional comments
To calculate our portfolio split, we weighted each company’s percentage turnover alignment against its weight in the portfolio.
Alignment results
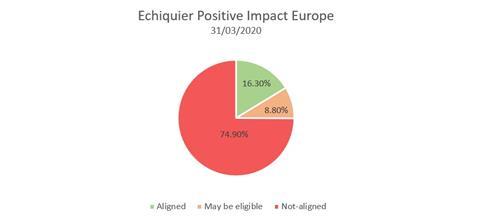
The results for Echiquier Positive Impact were as follows as of 31/03/2020:
- Aligned: 16.3%
- May be eligible: 8.8%
- Not aligned: 74.9%
We noted that companies were at very different levels in terms of their approach to the taxonomy. While some companies were not able to provide investors with a turnover split by end-markets use (e.g. ASML*), others already disclosed their taxonomy-aligned turnover (e.g. SPIE*).
Even though our assumptions were quite conservative, we were surprised that more than 75% of the portfolio was not aligned with the taxonomy. However, this figure is in line with the sectors the fund invests in.
*Securities and sectors are provided solely as examples and their inclusion in the portfolio may vary over time.


Challenges and solutions
| NO. | CHALLENGE | SOLUTION |
|---|---|---|
| 1 | Data availability at two different levels: •Some companies do not disclose their end-markets use turnover, precluding investors from assessing taxonomy alignment. •Threshold availability (e.g. activities relating to manufacture of hydrogen; no data available to compare with the 5.8tCO2e/t hydrogen as detailed in taxonomy). |
When data was unavailable and after discussions with the portfolio manager in charge of the company, we made comparisons with peers or relied on assumptions to obtain the turnover. We were not able to find any threshold for companies in our portfolio. |
| 2 | Understanding and interpreting the taxonomy. In some cases (particularly enablers and IT services) the taxonomy is complex and does not assess whether an activity is aligned. | We relied on PRI staff, broker reports and subjective interpretation. |
| 3 | It can be very challenging to assess taxonomy alignment for large cap companies or conglomerates, compared to small cap companies or pure players. | As end-market use is difficult to assess or quantify, at times we had to infer results from peer data. |
Recommendations
As so few companies currently report on the taxonomy, investing resources searching for data and studying company reports has limited value. To successfully implement the taxonomy a clear understanding of its framework and a comprehensive knowledge of companies in the portfolio is fundamental.


