| ORGANISATION DETAILS | |
|---|---|
| Name | BlueBay |
| Signatory type | Investment manager |
| Region of operation | Global |
| Assets under management | US$60.9bn (31/12/19) |
| COVERED BY THIS CASE STUDY | |
|---|---|
| Fund | BlueBay Global High Yield ESG Bond Fund
|
| Geography | Global (predominantly developed markets) |
| Sector | Multi-sectoral |
| Asset class | Fixed income - public debt (corporates) leveraged finance |
BlueBay supports the Commission’s Action Plan to ensure future economic development is founded on environmentally sustainable and socially responsible practices. Indeed, climate change may be a financially systemic risk, and as such, demands coordinated action from all stakeholders.
We welcome the development of the taxonomy as a tool that seeks to promote transparency and standardisation in respect of sustainability-related activities. This undertaking is challenging for many reasons and is likely to require adjustments over time, but nonetheless provides a useful starting point.
Taxonomy implementation
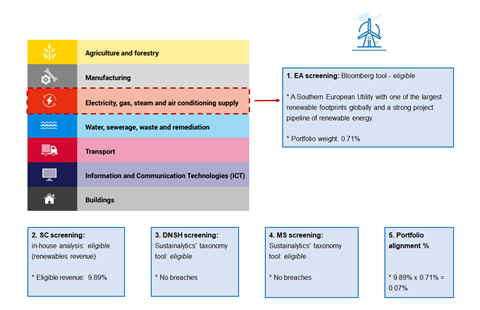
We aimed to screen the whole portfolio to test data availability (given high yield issuers can comprise of small/private companies) and identify the extent to which third parties could support investors in conducting either a full or partial analysis.
Our step-by-step approach:
- Economic activities (EA) screening:
We used a Bloomberg tool which enabled mapping of holdings in terms of 1) segmented revenues and 2) taxonomy qualifying EAs with NACE classification. - Substantial contribution (SC) screening:
As no third-party tool was yet available, we conducted an in-house analysis, reviewing publicly available information (issuer-generated or third-party) against taxonomy thresholds. In some cases, we also held discussions with analysts. - Do No Significant Harm (DNSH) screening:
We applied a beta-version of Sustainalytics’ taxonomy tool for each environmental objective, drawing on current controversies and norms-based products. We made conclusions at both the activity and company levels. The datapoints provided insights on breaches resulting from significant events, as well as flagging warnings on potential breaches via poor management scores and less severe events. - Minimum safeguards (MS) screening:
We applied a beta-version of Sustainalytics’ taxonomy tool, leveraging relevant social and governance events combined with UN Global Compact research to screen each issuer. - Portfolio taxonomy alignment calculations:
We conducted the calculation in-house as there is no third-party tool available and it is relatively straightforward.
Alignment results
- EA screening:
Though we selected a GHY (global high yield) portfolio for this case study, we also screened a European IG portfolio to compare data availability. Results revealed a significant data gap between strategies. The IG portfolio (larger companies) had a much higher portion of issuers reporting segmented revenues (100% by portfolio weight) than the GHY portfolio (46%) (smaller/private companies and less disclosure). - SC screening:
There may be many reasons why few companies passed this screen - for example, a lack or misalignment of data reported – and it cannot necessarily be explained by a failure to meet the thresholds themselves. Indeed, many of our holdings that have eligible revenue did not disclose environmental data that would allow SC tests to be met. Some sectors/economic activities, such as real estate, proved more difficult in terms of relevant environmental data disclosure. - DNSH/MS screening:
All the issuers we assessed passed these screens. This was not surprising as the portfolio is an ESG-orientated fund, excluding issuers deemed to be breaching or at high risk of breaching norms. - Portfolio taxonomy alignment:
Overall, the alignment was less than 3%, which was to be expected for the following reasons: the fund is a ‘responsibility’ fund rather than a “sustainability/environmentally thematic” fund; there was low data availability, which limited EA/SC screening; the approach taken in the absence of reported data was conservative; and, we did not conduct follow up engagements with issuers to address data gaps for the purpose of this case study.
Worked example

Portfolio taxonomy alignment summary information
| SECURITIES REPORTING SEGMENTED REVENUES: | 1. ECONOMIC ACITVITY SCREENING(% NAV) | 2. SUBSTANTIAL CONTRIBUTION SCREENING (% NAV) | 3. DNSH SCREENING (% NAV) | 4. MS SCREENING (% NAV) | 5. PORTFOLIO TAXONOMY ALIGNMENT (% NAV) |
|---|---|---|---|---|---|
| 51 securities (45.78% portfolio weight) | 24 securities (14.21% portfolio weight, including 6.42% with segment revenue proxies applied) | <3% | No change (<3%) | No change (<3%) | <3% |
Third-party tools available summary information
| THIRD PARTY | ECONOMIC ACTIVITY SCREENING | SUBSTANTIAL CONTRIBUTION SCREENING | DNSH SCREENING | MS SCREENING | NOTES |
|---|---|---|---|---|---|
| Bloomberg | Yes | Due to be released by sector Q4 2020-Q4 2021. Field mapping will be made immediately available, but company level % revenue scores will be published later in 2021. |
Partially met - Currently track DNSH in the Industry Disclosure template. This matches material disclosure under water, waste management, biodiversity, pollutants to water or air by industry segment:
|
Not yet - MS data sets are available in the Industry Disclosure template, or by company (195 social and 562 governance KPIs are captured from ‘as reported’ data).These are not yet integrated into a taxonomy-aligned tool. | EC screening tool already launched. SC in beta-testing.Awaiting clarity on portfolio application of DNSH/MSG screening – in RTS before integrating into model. |
| Sustainalytics | Partial solution available, leveraging Sustainable Products Research. | Not yet available, in development. | Bespoke tool – leverages of existing ESG controversies and norms-based screening tools available. Screens on events and management. | Bespoke tool – leverages of existing ESG controversies and norms-based screening tools available. Screens on events and Global Standards Compliance status. | Taxonomy tool in development – planned launch Q3/Q4 2020. |
| MSCI ESG Research | Data based on green/brown revenues already available in Environmental Impact and Climate Change Metrics datasets – although no predefined screens yet | MSCI data is based on Sustainable Impact Metrics datasets reviewed for alignment with the EU Taxonomy technical screening criteria (given issuer-disclosed data is not fully available currently) | Can screen currently with the appropriate combination of thresholds and data points. Screening guide released in July 2020. | Can screen currently with the appropriate combination of thresholds and data points. Screening guide released in July 2020. | Estimated EU Taxonomy Alignment screen projected to be available in August 2020. |
| RepRisk | No plans to produce | No plans to produce | No plans to produce | No plans to produce | No plans to produce |
| Vigeo Eiris | Not yet available – planned launch July 2020 | Not yet available – planned launch July 2020 | Not yet available – planned launch July 2020 | Not yet available – planned launch July 2020 | Open to participating - taxonomy tool in development – planned launch July 2020 |
| Trucost | Data mapping tool available | No plans to produce | Impact ratio can help with DNSH | S&P ESG scores can cover | No plans to produce |
Note: this is not necessarily a comprehensive list of third parties seeking to launch a taxonomy tool, only those that BlueBay engaged with over the course of Q2 2020. Data is correct as of 17th July 2020.
Challenges and solutions
| NO. | CHALLENGE | SOLUTION |
|---|---|---|
| 1 | No fully developed commercial solution in the market to fully or partially complete the taxonomy analysis. | We used a combination of different providers’ launched or beta-stage tools for some of the stages. For EA and SC, we used Bloomberg, and for the DNSH and MS, we used the Sustainalytics tool, a blend of the ESG controversies and norms-based screening with a taxonomy-tailored methodology. |
| 2 | Lack of data required to assess eligibility against EA and SC screening criteria (e.g. large number of economic activities not covered by NACE activities, lack of revenue disclosure based on NACE classification, lack of environmental performance disclosure against EU Taxonomy thresholds or other requirements). | We applied proxies where data did not exist, using the Bloomberg tool (added an additional 6.42% reported revenue in an eligible NACE). For the remaining ones, we did not undertake further in-house work. For aspects of SC screening, where the data was not available in respect of thresholds, we did not contact the issuer for information. Therefore, we may have understated the total portfolio taxonomy-aligned data. |
| 3 | Lack of data required to assess eligibility against DNSH/MS criteria (e.g. lack of reporting against DNSH criteria and MS requirements, differences across sectors, regions and issuer size). | We used the Sustainalytics tool, which leveraged their existing analysis, controversies and norms-based data as proxies. We did not engage with issuers directly on DNSH and MS requirements. We recognised, therefore, that this was not necessarily a comprehensive analysis of risks. |
Recommendations
We would recommend more transparency on scope, for example whether to use estimated or reported data. As SC screening is the most challenging step, it makes sense to undertake this after completing the DNSH/MS screening. If the latter fails, the former will not be necessary. However, if SC is required and there is no data, market participants should engage in-house analysts and issuers. Market participants should provide context for results, which may help explain reasons for a lack of alignment.


