| ORGANISATION DETAILS | |
|---|---|
| Name | AP Pension |
| Signatory type | Asset owner |
| Region of operation | Denmark |
| Assets under management | €20bn / US$22bn |
| COVERED IN THIS CASE STUDY | |
|---|---|
| Asset class | Equities |
| Sector | Not applicable |
| Geography | Global |
| Environmental objective | Mitigation and adaptation |
| Economic activity | All |
AP Pension believes that a common definition of what is considered sustainable is a fundamental element of providing sustainable investment solutions. The EU taxonomy provides this. Clients will now be able to compare sustainable products on an equitable basis, in the knowledge that the same criteria have been used to define what percentage of a portfolio is sustainable. This transparency is a crucial tool in achieving the ambitious goals set by the EU in funding the green transition.
Other aspect you would like to mention?
We used a concentrated portfolio of approx. 40 holdings for this case study.
Taxonomy implementation
Principles, criteria, thresholds
We leveraged Bloomberg’s EU taxonomy tool to determine the percentage of eligible revenue under the taxonomy, extracting data for each underlying holding in the portfolio. An immediate challenge was to identify the proportion of eligible revenue that was aligned with the taxonomy. We applied ISS’ (Institutional Shareholder Services) Assessment of the SDGs, measuring companies’ SDG adherence with a numerical score and as a percentage of revenue. We focused on the contribution of ISS’ SDG Solutions Assessment methodology to the environmental objectives. This specifically measures the part played by climate mitigation, alongside optimising material use and promoting sustainable buildings. On an aggregated level it can be used as a proxy for climate adaption. We then estimated what parts of the eligible revenue were taxonomy-aligned. However, we could not measure if each activity met the technical thresholds, but rather used ISS methodology as an estimate for taxonomy qualification.
Do no significant harm assessment
We used ISS’ SDG Assessment, which determines the percentage of a company’s revenue that is characterised as “significant obstruction” of the environmental themes covered by ISS. In this case study, companies with revenue that significantly obstructs any of the environmental themes were not eligible for taxonomy alignment.
Social safeguards assessment
To ensure companies have sufficient social safeguards, we used Sustainalytics’ Global Standards Screening as a proxy. This tool assesses a company’s level of compliance with, for example, the UN Global Compact Principles and the OECD Guidelines for Multinational Enterprises. Sustainalytics rates a company as compliant, watchlist or non-compliant. In this case study, companies rated as non-compliant were not eligible for taxonomy alignment.
Turnover/capex/opex alignment
To calculate the proportion of the portfolio that was taxonomy-aligned, we applied “percent of revenue”, as per the ISS SDG Assessment methodology. This provides the percentage of revenue linked to activities that contribute to the SDGs. We calculated the percentage of revenue contributing to climate mitigation and/or adaption for each company. Multiplying that percentage by the weight of the position in the portfolio gave the total taxonomy alignment.
Additional comments
Overall, we felt that the case study gave us an approximation of what could be taxonomy-aligned. However, we did not have the data to assess if each of the eligible activities met the technical screening criteria.
Alignment results
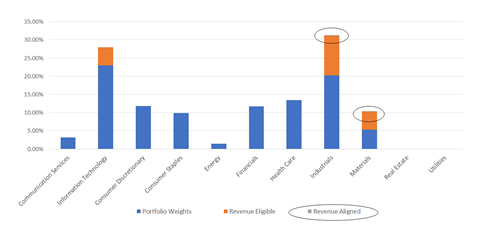
Approximately 20% of the portfolio’s revenue was eligible for the taxonomy. However, the data available meant that only 0.24% of the eligible revenue was taxonomy-aligned. According to the Bloomberg database, nine companies had revenue that was eligible, but only four met the criteria for alignment, all of which were in the industrials and materials sectors. The low level of eligibility and alignment is reflected in the current sector allocation of the fund. The portfolio has limited or no exposure to the three sectors that have the highest alignment potential: communication services, real estate and utilities.
The case study was limited by data availability. Some of the metrics used did not specifically apply to the taxonomy, instead measuring activities along similar lines to the taxonomy.
Portfolio

Challenges and solutions
| NO. | CHALLENGE | SOLUTION |
|---|---|---|
| 1 | Data availability | Used data from various sources, though some of it did not specifically apply to the taxonomy. |
| 2 | Technical thresholds | Used available data as a proxy for what may potentially be taxonomy-aligned, ignoring technical screening criteria. |
Recommendations
The EU has drawn up a clear taxonomy with precise technical screening criteria. However, a critical element in effective implementation will be streamlining of data delivery to market participants. Indeed, a lack of streamlining and multiple data sources may lead to conflicting results.


